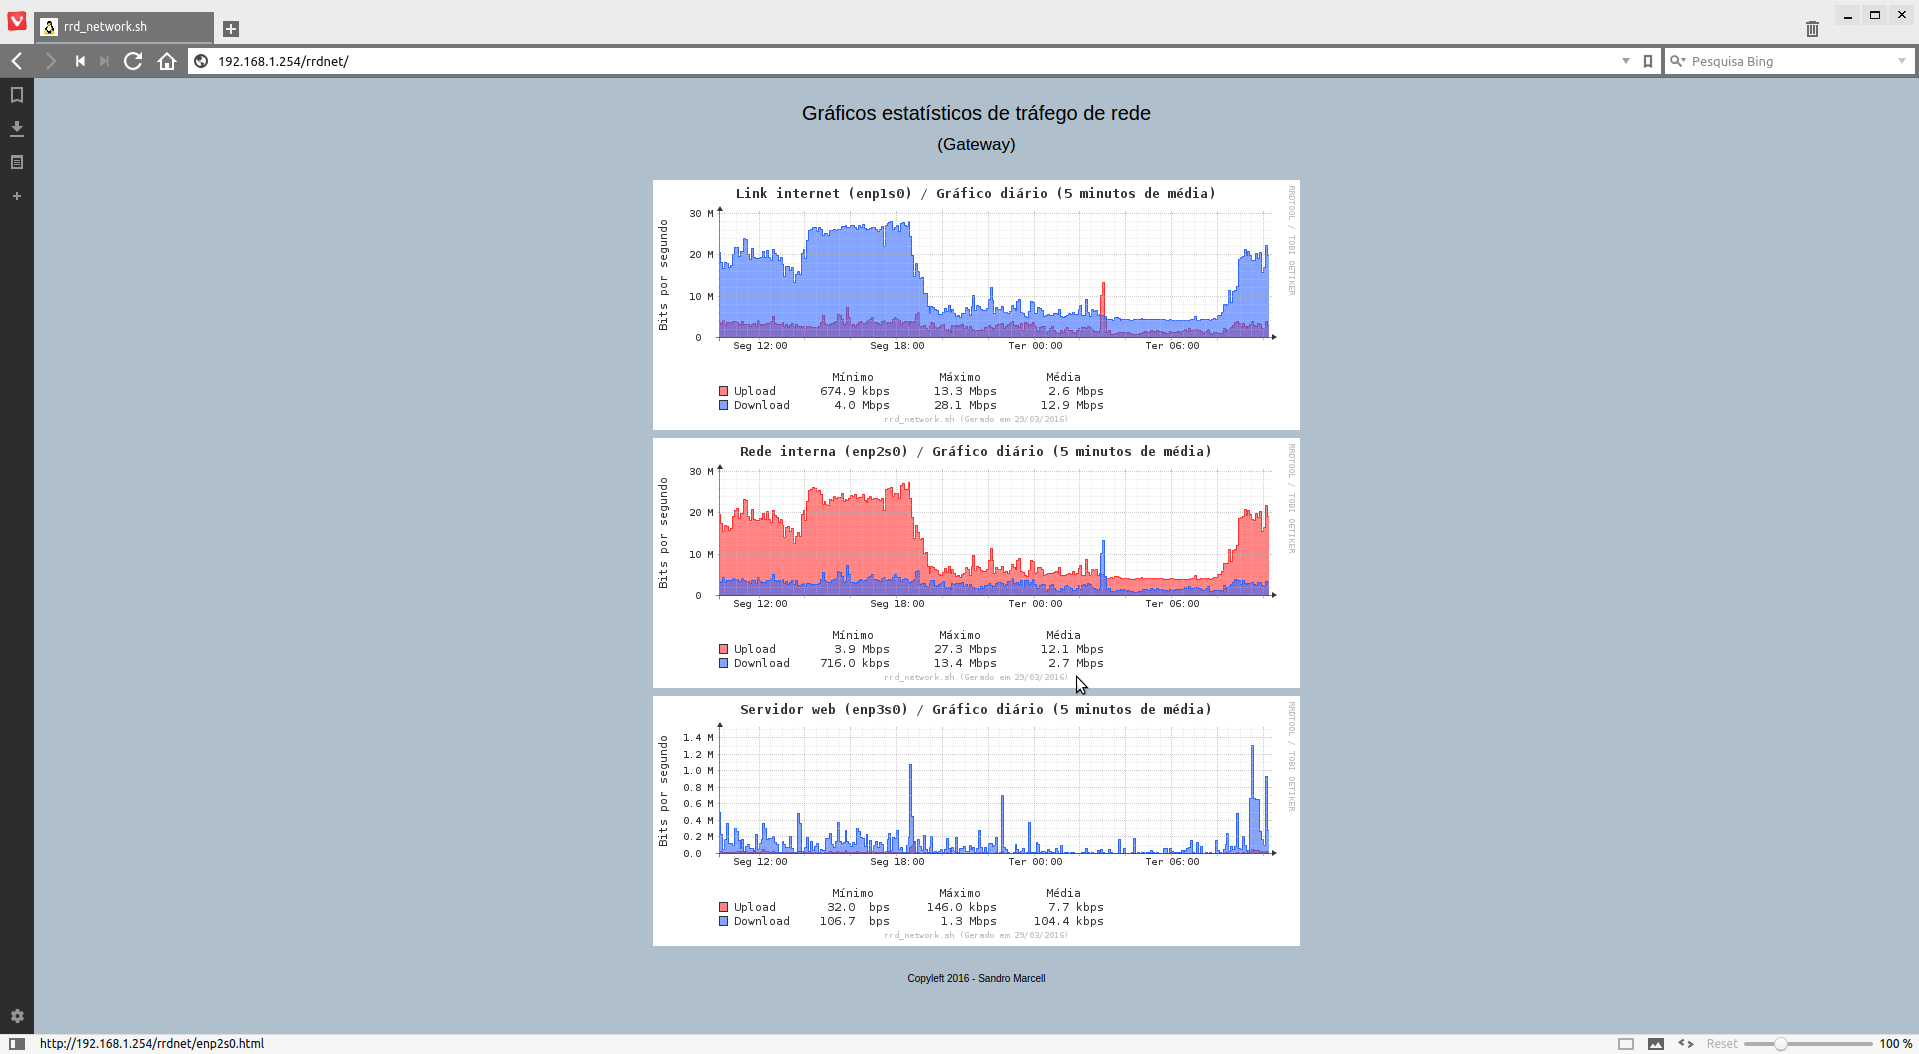
Bash: Gráficos estatísticos de tráfego de rede

Publicado por Sandro Marcell em 04/04/2016
[ Hits: 5.913 ]
Blog: http://sanmarcell.wordpress.com

Bash: Gráficos estatísticos de tráfego de rede
- RRDtool v1.4.7
- Bash v4.1.10
- Lighttpd v1.4.35
- Linux 2.6.37.6
A configuração e uso do script é bem simples, bastando fazer o seguinte:
Alterar as variáveis globais conforme necessário.
Executar o script para gerar as bases de dados:
# ./nome_script.sh
Executar novamente o script, mas agora para gerar as páginas .html:
# ./nome_script.sh -html
Agora agende no cron do usuário root a execução do script a cada 5 minutos:
E finalmente acesse via navegador web a página HTML gerada.
Feito tudo isso você terá uma página mais ou menos como esta:
Segue o código do script:
#!/bin/bash
#
# Copyleft 2016 Sandro Marcell <smarcell@mail.com>
#
# This program is free software; you can redistribute it and/or modify
# it under the terms of the GNU General Public License as published by
# the Free Software Foundation; either version 2 of the License, or
# (at your option) any later version.
#
# This program is distributed in the hope that it will be useful,
# but WITHOUT ANY WARRANTY; without even the implied warranty of
# MERCHANTABILITY or FITNESS FOR A PARTICULAR PURPOSE. See the
# GNU General Public License for more details.
#
# You should have received a copy of the GNU General Public License
# along with this program; if not, write to the Free Software
# Foundation, Inc., 51 Franklin Street, Fifth Floor, Boston,
# MA 02110-1301, USA.
#
PATH='/bin:/sbin:/usr/bin:/usr/sbin'
LC_ALL='pt_BR.UTF-8'
# Como utilizar este script:
#
# 1 - Altera as VARIAVEIS GLOBAIS conforme necessario
# 2 - Execute o script para gerar as bases de dados
# root> ./nome_script.sh
# 3 - Execute novamente o script, mas agora para gerar as paginas .html
# root> ./nome_script.sh --html
# 4 - Agende no cron do usuario root a execucao do mesmo (de 5 em 5 min.)
# */5 * * * * /caminho/para/nome_script.sh > /dev/null 2>&1
# 5 - Acesse as paginas .html geradas atraves dum navegador web
#
# Desenvolvido com: rrdtool v1.4.7, Bash v4.1.10 e Linux 2.6.37.6
# Diretorio onde serao armazenadas as bases de dados do rrdtool
BASES_RRD='/var/lib/rrd'
# Diretorio do servidor web onde serao armazenados os arquivos html/png gerados
DIR_WWW='/var/www/html/rrdnet'
# Gerar os graficos para os seguintes periodos de tempo
PERIODOS='day week month year'
# Interfaces de rede que serao monitoradas
# Este vetor deve ser definido da seguinte forma:
# <interface1> <descricao> <interface2> <descricao> <interface3> <descricao> ...
# Ex.: Supondo que seu servidor possua tres interfaces de rede, onde
# eth0 = Link para a internet
# eth1 = Link da LAN
# eth2 = Link para a DMZ
# entao faca:
# INTERFACES=('eth0' 'Link internet' 'eth1' 'Link LAN' 'eth2' 'Link DMZ')
INTERFACES=('lo' 'Loopback' 'eth0' 'Link LAN')
# Criando os diretorios de trabalho caso nao existam
[ ! -d "$BASES_RRD" ] && mkdir -p "$BASES_RRD"
[ ! -d "$DIR_WWW" ] && mkdir -p "$DIR_WWW"
# Funcao principal que sera responsavel pela coleta e armazenamento/atualizacao
# das bases de dados rrd
function coletarDados {
declare -a args=("${INTERFACES[@]}") # Aquele POG basico... ^_^
while [ ${#args[@]} -ne 0 ]; do
iface="${args[0]}" # Interface a ser monitorada
desc="${args[1]}" # Descricao da interface monitorada
args=("${args[@]:2}")
# Coletando os valores recebidos/enviados pela interface
# Obs.: Os valores sao coletados em bytes mas ao se gerar
# os graficos, esses dados serao convertidos para bits
local bytes_rec=$(</sys/class/net/$iface/statistics/rx_bytes)
local bytes_env=$(</sys/class/net/$iface/statistics/tx_bytes)
# Caso as bases rrd nao existam, entao serao criadas e cada uma
# tera o mesmo nome da interface monitorada
if [ ! -e "${BASES_RRD}/${iface}.rrd" ]; then
echo "Criando base de dados rrd: ${BASES_RRD}/${iface}.rrd"
rrdtool create ${BASES_RRD}/${iface}.rrd --start 0 \
DS:in:DERIVE:600:0:U \
DS:out:DERIVE:600:0:U \
RRA:AVERAGE:0.5:1:576 \
RRA:AVERAGE:0.5:6:672 \
RRA:AVERAGE:0.5:24:732 \
RRA:AVERAGE:0.5:144:1460
[ $? -gt 0 ] && return 1
fi
# Se as bases ja existirem, entao atualize-as...
echo "${BASES_RRD}/${iface}.rrd: Atualizando base de dados..."
rrdtool update ${BASES_RRD}/${iface}.rrd -t in:out N:${bytes_rec}:$bytes_env
[ $? -gt 0 ] && return 1
# ... e depois gere os graficos
gerarGraficos
done
return 0
}
# Funcao responsavel pela plotagem e criacao dos graficos
function gerarGraficos {
local titulo="$desc ($iface)"
for p in $PERIODOS; do
case $p in
'day') tipo='Gráfico diário (5 minutos de média)' ;;
'week') tipo='Gráfico semanal (30 minutos de média)';;
'month') tipo='Gráfico mensal (2 horas de média)' ;;
'year') tipo='Gráfico anual (1 dia de média)' ;;
esac
rrdtool graph ${DIR_WWW}/${iface}_${p}.png --start -1$p --font "TITLE:0:Bold" --title "$titulo / $tipo" \
--lazy --watermark "${0##*/} (Gerado em $(date "+%d/%m/%Y"))" --vertical-label "Bits por segundo" \
--height 124 --width 550 --lower-limit 0 --imgformat PNG \
--color "BACK#FFFFFF" --color "SHADEA#FFFFFF" --color "SHADEB#FFFFFF" \
--color "MGRID#AAAAAA" --color "GRID#CCCCCC" --color "ARROW#333333" \
--color "FONT#333333" --color "AXIS#333333" --color "FRAME#333333" \
DEF:in_bytes=${BASES_RRD}/${iface}.rrd:in:AVERAGE \
DEF:out_bytes=${BASES_RRD}/${iface}.rrd:out:AVERAGE \
CDEF:in_bits=in_bytes,8,* \
CDEF:out_bits=out_bytes,8,* \
VDEF:min_in=in_bits,MINIMUM \
VDEF:min_out=out_bits,MINIMUM \
VDEF:max_in=in_bits,MAXIMUM \
VDEF:max_out=out_bits,MAXIMUM \
VDEF:avg_in=in_bits,AVERAGE \
VDEF:avg_out=out_bits,AVERAGE \
"COMMENT:$(printf "%2s")\l" \
"COMMENT:$(printf "%21s")" \
"COMMENT:Mínimo$(printf "%7s")" \
"COMMENT:Máximo$(printf "%7s")" \
"COMMENT:Média\l" \
"COMMENT:$(printf "%5s")" \
"AREA:out_bits#FE2E2E95:Upload$(printf "%4s")" \
"LINE1:out_bits#FE2E2E" \
"GPRINT:min_out:%5.1lf %sbps$(printf "%3s")" \
"GPRINT:max_out:%5.1lf %sbps$(printf "%3s")" \
"GPRINT:avg_out:%5.1lf %sbps$(printf "%3s")\l" \
"COMMENT:$(printf "%5s")" \
"AREA:in_bits#2E64FE95:Download$(printf "%2s")" \
"LINE1:in_bits#2E64FE" \
"GPRINT:min_in:%5.1lf %sbps$(printf "%3s")" \
"GPRINT:max_in:%5.1lf %sbps$(printf "%3s")" \
"GPRINT:avg_in:%5.1lf %sbps$(printf "%3s")\l" 1> /dev/null
[ $? -gt 0 ] && return 1
done
return 0
}
# Funcao que ira criar as paginas .html
function gerarHTML {
declare -a ifaces
local titulo='Gráficos estatísticos de tráfego de rede'
# Filtrando o vetor $INTERFACES para retornar somente as interfaces de rede
for ((i = 0; i <= ${#INTERFACES[@]}; i++)); do
((i % 2 == 0)) && ifaces+=("${INTERFACES[$i]}")
done
echo 'Gerando paginas HTML...'
# 1o: Gerar a pagina index.html
cat <<- FIM > ${DIR_WWW}/index.html
<!DOCTYPE html PUBLIC "-//W3C//DTD XHTML 1.0 Strict//EN"
"http://www.w3.org/TR/xhtml1/DTD/xhtml1-strict.dtd">
<html xmlns="http://www.w3.org/1999/xhtml" xml:lang="en" lang="en">
<head>
<title>${0##*/}</title>
<meta http-equiv="content-type" content="text/html;charset=utf-8" />
<meta http-equiv="refresh" content="300" />
<meta http-equiv="cache-control" content="no-cache" />
<meta name="author" content="Sandro Marcell" />
<style type="text/css">
body {
margin: 0;
padding: 0;
background-color: #AFBFCB;
width: 100%;
height: 100%;
font: 20px/1.5em Helvetica, Arial, sans-serif;
}
a:link, a:hover, a:active {
text-decoration: none;
color: #AFBFCB;
}
#header {
text-align: center;
}
#content {
position: relative;
text-align: center;
margin: auto;
}
#footer {
font-size: 10px;
text-align: center;
}
</style>
</head>
<body>
<div id="header">
<p>$titulo<br /><small>($(hostname))</small></p>
</div>
<div id="content">
$(for i in ${ifaces[@]}; do
echo "<div><a href="\"${i}.html\""><img src="\"${i}_day.png\"" alt="\"${0##*/} --html\"" /></a></div>"
done)
</div>
<div id="footer">
<p>Copyleft 2016 - Sandro Marcell</p>
</div>
</body>
</html>
FIM
# 2o: Gerar pagina especifica para cada interface com os periodos definidos
for i in ${ifaces[@]}; do
cat <<- FIM > ${DIR_WWW}/${i}.html
<!DOCTYPE html PUBLIC "-//W3C//DTD XHTML 1.0 Strict//EN"
"http://www.w3.org/TR/xhtml1/DTD/xhtml1-strict.dtd">
<html xmlns="http://www.w3.org/1999/xhtml" xml:lang="en" lang="en">
<head>
<title>${0##*/}</title>
<meta http-equiv="content-type" content="text/html;charset=utf-8" />
<meta http-equiv="refresh" content="300" />
<meta http-equiv="cache-control" content="no-cache" />
<meta name="author" content="Sandro Marcell" />
<style type="text/css">
body {
margin: 0;
padding: 0;
background-color: #AFBFCB;
width: 100%;
height: 100%;
font: 20px/1.5em Helvetica, Arial, sans-serif;
}
#header {
text-align: center;
}
#content {
position: relative;
text-align: center;
margin: auto;
}
#footer {
font-size: 10px;
text-align: center;
}
</style>
</head>
<body>
<div id="header">
<p>$titulo<br /><small>($(hostname))</small></p>
</div>
<div id="content">
$(for p in $PERIODOS; do
echo "<div><img src="\"${i}_${p}.png\"" alt="\"${0##*/} --html\"" /></div>"
done)
</div>
<div id="footer">
<p>Copyleft 2016 - Sandro Marcell</p>
</div>
</body>
</html>
FIM
done
return 0
}
# Gerar os arquivos .html se for o caso
# Chamada do script: ./nome_script.sh --html
if [ "$1" == '--html' ]; then
gerarHTML
exit 0
fi
# Coletando dados e gerando os graficos
# Chamada do script: ./nome_script.sh
coletarDados
Download do código-fonte: rrd_network.sh
Faloura!!!
js-bwm: monitorando seu link de internet em tempo real
Declarando constantes em shell scripts
Formatando números no shell com zeros à esquerda
Zsh: Menu de autocompletar para o comando kill
Verificando disco de backup e enviando e-mail
Resolvendo waiting ou idle transaction no PostgreSQL
Alterando as ID tags de seus arquivos de áudio em massa pelo terminal
Nova versão aqui: https://github.com/SandroMarcell/rrd-network
Patrocínio

Destaques
Artigos
SynapSeq - programa para estimular as ondas cerebrais
Por que seu __DIR__ falhou ou o "inferno" dos caminhos no PHP
Preparando-se para certificações da LPI através do LPI Lab
Migração de Arch Linux para repositórios CachyOS (Uso de Instruções v3 e v4)
Dicas
As diferencas entre o clipboard comum e a selecao ativa
Arch Linux com repos do CachyOS para otimização ou usar Gentoo?
Ativando o modo Quake no XFCE4-Terminal
[Tutorial] Configurando Multimaster no Samba 4 AD (DC02) + Explicação de FSMO Roles
Tópicos
Abrir um arquivo URL pelo Clipper (4)
Eu aprendi o segredo das artes! hahaha (0)
Instalação Dual Boot Linux+Windows 11 [RESOLVIDO] (5)
Top 10 do mês
-

Xerxes
1° lugar - 136.922 pts -

Fábio Berbert de Paula
2° lugar - 70.049 pts -

Buckminster
3° lugar - 45.882 pts -

Alberto Federman Neto.
4° lugar - 36.929 pts -

Alessandro de Oliveira Faria (A.K.A. CABELO)
5° lugar - 24.542 pts -

edps
6° lugar - 23.680 pts -

Daniel Lara Souza
7° lugar - 22.423 pts -

Sidnei Serra
8° lugar - 22.112 pts -

Mauricio Ferrari (LinuxProativo)
9° lugar - 20.942 pts -

Andre (pinduvoz)
10° lugar - 17.304 pts
Scripts
A maior comunidade GNU/Linux da América Latina! Artigos, dicas, tutoriais, fórum, scripts e muito mais. Ideal para quem busca auto-ajuda.
Site hospedado por: